.png?width=150&height=63&name=TWRlogo-regmark_blueblack%20(1).png)
.png)


Editor’s Note: This article is part of a series. View all the articles in this series here: QuickBooks Online Tips
It's easy to focus on incoming payments, but true financial health goes beyond the balance in your bank account. The real story is hidden within QuickBooks Online (QBO) reports, where key insights about business performance, profitability, and potential risks come to light.
Mastering QuickBooks Online reports is like gaining a superpower—the ability to spot trends, identify top revenue sources, and catch red flags before they become problems. Learning how to customize and interpret reports effectively can help you make more informed financial decisions.
The QuickBooks Online reports landscape: a quick tour
Understanding where to find reports in QBO is the first step. Depending on your subscription level (Simple Start, Essentials, Plus, or Advanced), you’ll have access to different types of reports.
You can access reports through multiple paths in QBO:
- Dashboards – Interactive charts provide a visual summary of financial data.
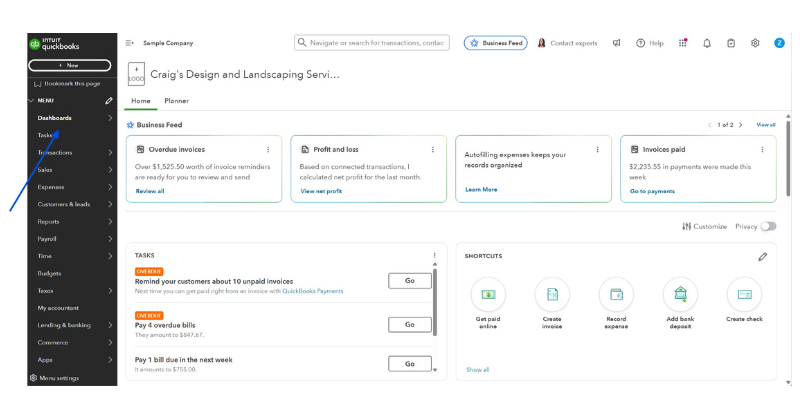
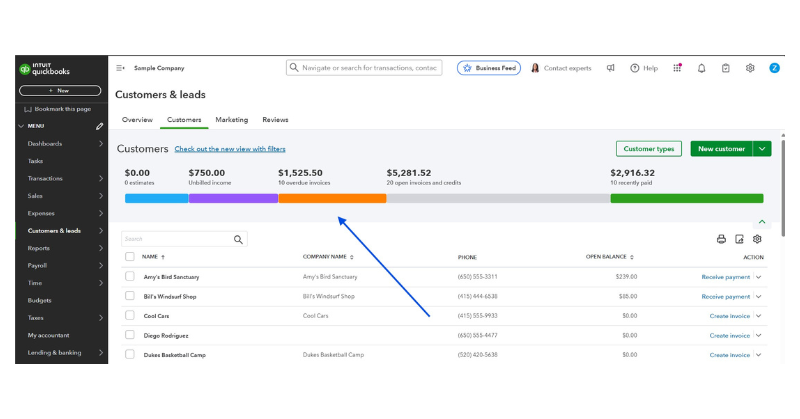
- Money Bars – Found in the customer and vendor centers, allowing quick filtering of transactions.
- Quick Reports – Available from the Action drop-down in lists and transaction pages, offering a focused look at a specific item.
- Transaction Journal – Displays the behind-the-scenes double-entry accounting, showing debits and credits for each transaction.
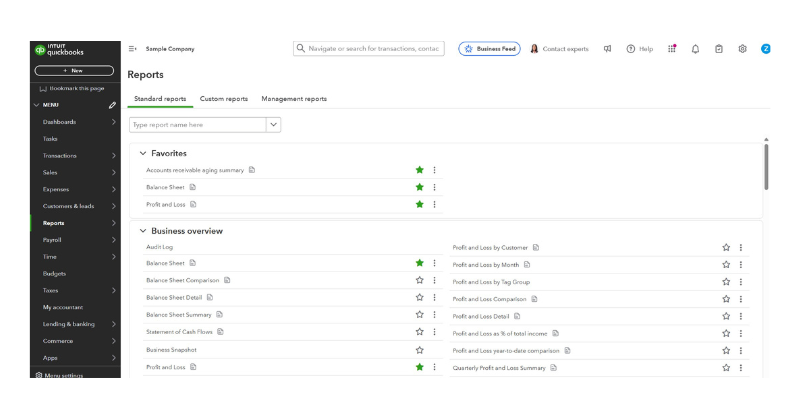
- Reports Center – The main hub for all reports, categorized by type, with search functionality, favorites, and custom report options.
Cash vs. accrual: two sides of the financial coin
Before diving into custom reports, it’s important to understand the difference between cash basis and accrual basis accounting.
- Cash basis – Records income when payments are received and expenses when they are paid.
- Accrual basis – Recognizes income when an invoice is sent and expenses when a bill is recorded, regardless of when the payment occurs.
Most small businesses file taxes using cash basis accounting, but accrual reports provide a more complete picture of financial health by accounting for unpaid invoices and bills.
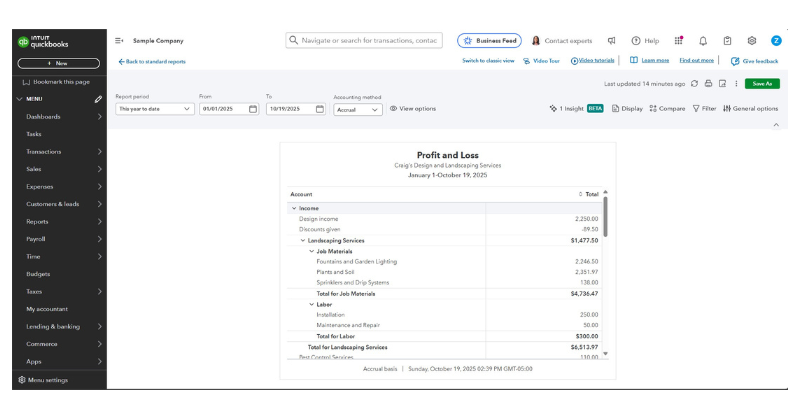
QuickBooks Online allows users to toggle between cash and accrual views when running reports.
Essential reports every business owner should know
Understanding the most important financial reports is crucial for managing a business effectively. Be sure to take a moment to explain these reports to your clients:
Profit and Loss (P&L) – A financial snapshot that summarizes revenue, cost of goods sold, expenses, and net profit or loss over a specific period. This report is key for assessing profitability.
 Balance Sheet – A real-time look at business health, showing assets (what you own), liabilities (what you owe), and equity (owner’s stake in the company). Understanding this report is crucial for financial stability.
Cash Flow Statement – Tracks the movement of cash in and out of the business, helping you understand liquidity and whether you have enough cash to meet upcoming obligations.
Slightly beyond the basics: power up your reporting
QBO offers additional reports that provide deeper insights into business performance. Introduce your clients to these reports to keep tabs on their business activity.
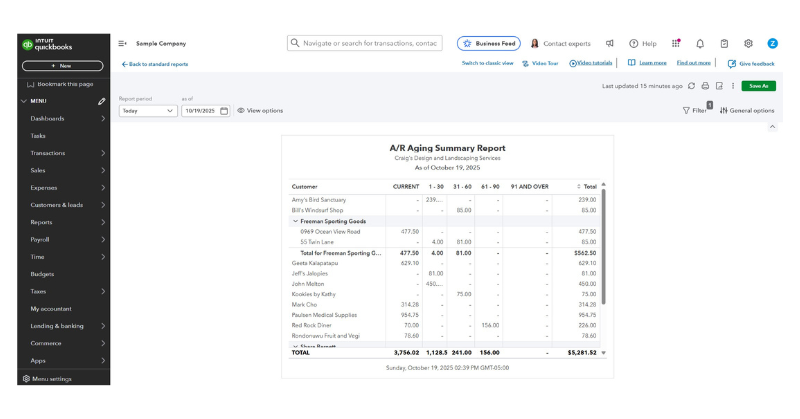
Accounts Receivable (AR) Aging Summary – Tracks unpaid invoices, helping businesses manage collections and cash flow.
 Accounts Payable (AP) Aging Summary – Shows outstanding bills, allowing businesses to prioritize payments and avoid late fees.
Income by Customer Summary – Identifies top customers and their contribution to total revenue, helping businesses refine marketing and sales efforts.
Sales by Product/Service Summary – Breaks down sales performance by item, highlighting best-selling products or services.
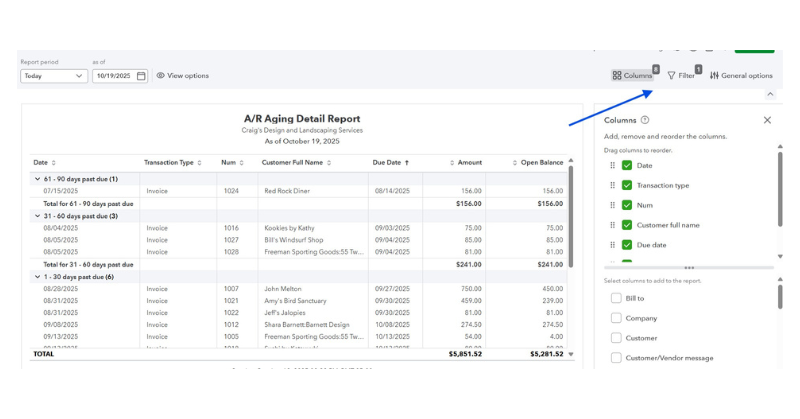
Customizing reports: making QBO work for you
QBO’s customization tools allow businesses to tailor reports to their specific needs for better financial analysis.
- Customize columns – Select the most relevant data points.
- Filter data – Focus on specific customers, products, or time periods.
- Compare periods – Track trends over time by comparing different reporting periods.
- Collapse and expand sections – View summaries or drill down into details.
- Sort data – Arrange results in ascending or descending order for clarity.
- Format numbers – Adjust how figures are displayed for easier readability.
- Save customizations – Store frequently used report settings for future use.
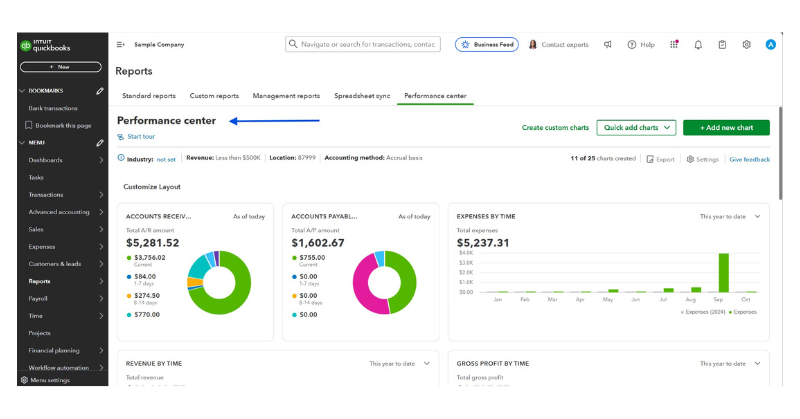
QuickBooks Online Advanced: enhanced reporting features
Businesses that need more advanced reporting capabilities will benefit from QuickBooks Online Advanced, which includes additional tools for financial analysis. As you review the year with your client, create new reports that answer their questions:
Performance Center – Offers industry-specific interactive charts and performance tracking to monitor key financial metrics.
 Custom Report Builder – Enables multidimensional reporting by pulling data from multiple tables, creating pivot tables and visual reports.
Custom Fields – Allows users to add unique data points for better filtering and reporting.
Spreadsheet Sync – Integrates with Excel for live data updates, custom templates, and multi-company consolidated reports.
Harnessing the power of reports: a call to action
QBO reports are more than just numbers on a page—they are powerful decision-making tools. By mastering report customization and analysis, businesses can gain deeper financial insights, optimize operations, and improve profitability.


Do you have questions about this article? Email us and let us know > info@woodard.com
Comments: